3-D Datacube Visualizer
(dedicated to L1551 IRS 5, as well as
a universal visualization tool)
This module will present the archival data in the position-position-velocity (therefore three dimensional) space, to intuitively show the kinematics in star forming regions. The goal is to provide an alternative and more efficient way to present the outflows and/or fragmentation other than conventional methods such as channel maps and velocity field.
The motivation to develop this module is that, first, the radio astronomy observations provide us 3-D datacubes, and second, it is always a pain when we want to show a 3-D structure in a 2-D image. Let’s take a look at a few cases.
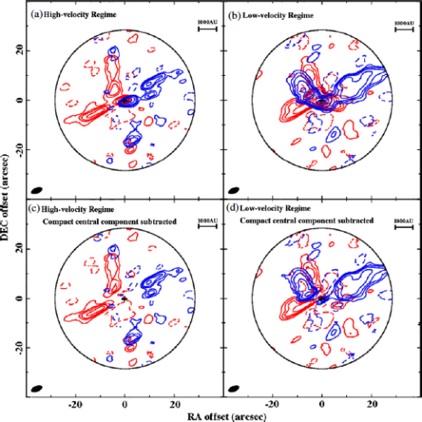
Here is an image taken from Wu, Takakuwa & Lim, 2009. The blue or red colors mark the blue-shifted or red-shifted lobes with respect to the systemic velocity. Can you imagine how it looks like in 3-D? How you think of the outflows in this system? I believe that some people have the talent to construct a high dimensional structure in the brain, but it will be more convenient if we can intuitively inspect the situation.
So is there any other way to help us better understand what is happening here? The answer is YES. You may have realized that, instead of chopping the datacube into channels and show them one by one, we can simply display the datacube itself and let the pictures speak! Of course, we need something more than a static picture, and an interactive one is even better so that we can rotate and zoom in to investigate the details of the data.
Ok, it’s cool to display a 3-D datacube, but has anyone done it before? The answer, again, is YES. Astronomers have developed various softwares, from one of the most popular tools in astronomy, SAO DS9 (after version 7), to some dedicated visualization tool such as Gaia3D. They can load the standard FITS format datacubes directly and display them in an interactive way. In addition, astronomers take advantage of available softwares from beyond astronomy, such as 3DSlicer and VisIt, to create publication-quality 3-D images, which turns out to be very efficient. For the progress in this field, Prof. Alyssa Goodman has a very good review.
Then the question is, why do we want to do it again? Well, there are a few reasons I can think of. First, compared to DS9 and Gaia3D, it is more flexible to build it with a general-purpose language, such as python here, because we can edit the code directly and add any feature we want. For example, in order to show the orientation of outflows, we can add arrows into the scene freely, which will be difficult to do for DS9. Second, compared to 3DSlicer, the abundant astronomical packages in python library will provide us better support for handling and understanding the data. Last, it is always exciting to have more than one way to do something!
So the entire module is written in python. The visualization is fulfilled by the MayaVi package. The interactive user interface is made with TraitsUI, another python package, in which you can choose volume rendering (scattered data points) or surface rendering (iso-surfaces). You can add a cutthrough view to check how the data look like on a particular plane. For surface rendering, you can save the scene in an OBJ format file which can be converted to a U3D format file with softwares like DAZ3D or MeshLab and then inserted into PDF files.
For L1551 IRS 5 particularly, we can mark the outflows with colorful arrows. These arrows can also be saved in the object file and shown in PDF files, but the conversion is not perfect and colors might be lost in the final PDF page.
Below is a piece of movie made from snapshots of the MayaVi scene. Once you download the script and start to run it, you will be able to create your own movies with your 3-D datacubes!